Performance Analysis of Java Applications with Bootchart-like Diagrams
I've just completed a bootchart-like utility, for analyzing Java programs running behaviour. Here's a sample of it's output (IntelliJ IDEA compilation process):
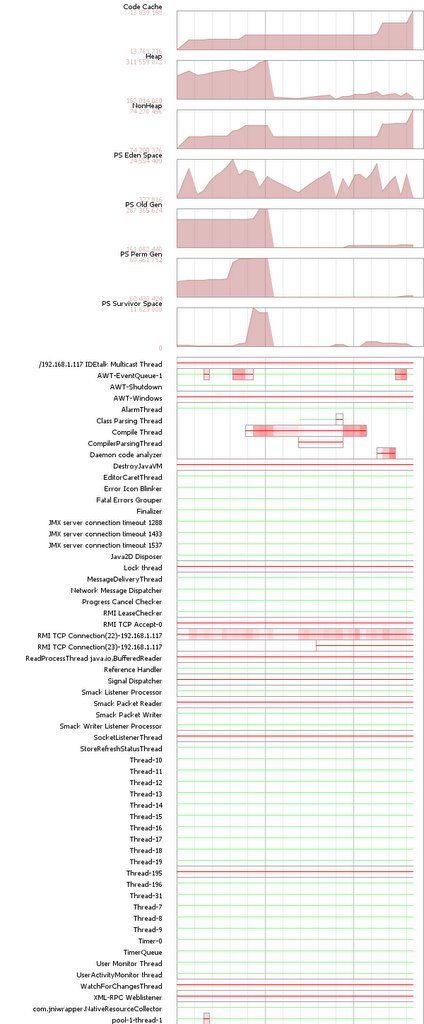
On top of it there are several memory metrics graphs, on the bottom - the most important part - threads chart. The short legend:
- red line - thread in running state
- green line - thread in the other (waiting, blocked) state
- no line - thread doesn't exist
- red background - the amount of User CPU time consumed (more red = more User CPU time)
Here's much larger chart:

Technorati tags: java jmx performance bootchart intellij
posted by Mike @ 5:28 AM
2 comments
![]()

